2023 Overview
| Item | 2023 | 2022 | 2021 |
| (In Millions, except per-share information) | |||
| Net Sales | $18,246 | $17,652 | $16,802 |
| Adjusted Earnings Per Diluted Share (from continuing ops) (1) | $7.67 | $6.05 | $6.77 |
| Dividends Per Share | $2.54 | $2.42 | $2.26 |
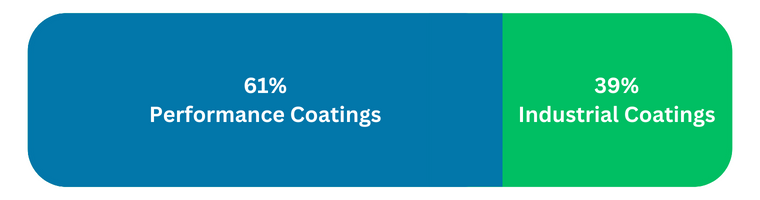
Net Sales by Reportable Segment
| Item | 2023 2022 | $ Change % Change |
| (In Millions, Except Per-Share Information, Percentages, & Number of Employees) | ||
| Net Sales | $18,246 $17,652 | $594 3% |
| Net Income (attributable to PPG) | ||
| Income from continuing operations | $1,270 $1,028 | $242 24% |
| (Loss)/income from discontinued operations | - $(2) | $2 (100%) |
| Net income (attributable to PPG) | $1,270 $1,026 | $244 24% |
| Earnings per diluted share from continuing operations | $5.35 $4.33 | $1.02 24% |
| (Loss)/Income Per Diluted Share from Discontinued Operations | - $(0.01) | $0.01 (100%) |
| Total Earnings Per Diluted Share | $5.35 $4.32 | $1.03 24% |
| Adjusted Earnings Per Diluted Share (from continuing operations) (1) | $7.67 $6.05 | $1.62 27% |
| Dividends Per Share | $2.54 $2.42 | $0.12 5% |
| Return on Average Capital | 10.4% 8.8% | 1.6% 18% |
| Cash from Operating Activities | $2,411 $963 | $1,448 150% |
| Capital Spending (excluding business acquisitions) | $549 $518 | $31 6% |
| Research and Development | $456 $470 | ($14) (3%) |
| Average Shares Outstanding - Assuming Dilution | 237.2 237.3 | (0.1) 0% |
| Average Number of Employees | 53,000 52,000 | 1,000 2% |
| PPG Shareholders' Equity | $7,832 $6,592 | $1,240 19% |
1. Adjusted earnings per diluted share amounts in 2023, 2022 and 2021 excludes certain per diluted share amounts of $2.32, $1.72 and $0.84, respectively. For detailed information regarding these adjustments, see the Regulation G Reconciliation in Item 7 of the Form 10-K.
PPG Shareholder Information
| Quarterly Stock Market Price | 2023 | 2022 |
| Quarter Ended | High Low | High Low |
| 31-Mar | $137.74 $120.90 | $177.32 $111.32 |
| 30-Jun | $149.01 $130.65 | $138.10 $107.06 |
| 30-Sep | $152.89 $126.94 | $137.93 $109.78 |
| 31-Dec | $151.16 $120.33 | $137.72 $107.40 |
The number of holders of record of PPG common stock as of January 31, 2024 was 12,791 as shown on the records of the Company's transfer agent.
| Dividends | 2023 | 2022 |
| Month of Payment | Amount Per Share (millions) | Amount Per Share (millions) |
| March | $146 $0.62 | $139 $0.59 |
| June | $146 $0.62 | $140 $0.59 |
| September | $153 $0.65 | $145 $0.62 |
| December | $153 $0.65 | $146 $0.62 |
| Total | $598 $2.54 | $570 $2.42 |
PPG has paid uninterrupted annual dividends since 1899. The latest quarterly dividend of 65 cents per share was approved by the board of directors on January 18, 2024, payable March 12, 2024 to shareholders of record February 16, 2024.